Revisiting the Expected Return of the Stock Market
A few months ago I posted a short video, titled ‘The Most Important Number You Won’t Find in the Wall Street Journal,’ which described a simple way to forecast the long term expected real return of the stock market. The method consisted of adding together the ‘three easy pieces’ of 1) the market’s current dividend yield, plus, 2) expected real dividend growth, plus, 3) an adjustment for any forecast change in stock market valuation. At very long horizons, say 50 years, the adjustment for one’s expected change in stock market valuation has a small impact on expected returns. For global equities, this approach suggests a long-term inflation adjusted expected return of about 4.5% based on current market pricing.
In the video, I showed that this approach gave a good estimate for the two 50 year non-overlapping periods for which we have good stock market data, 1915 to 1965 and 1965 to 2015. I received quite a few comments and questions, with many people asking whether the 1915 and 1965 starting dates were particularly good times for this forecasting method. The chart below addresses this by showing the forecast for the real return of the US stock market on a rolling basis from 1872 to 1965, using data from Professor Robert Shiller’s website. For roughly 90% of the 1,120 monthly forecasts, the forecast was within 1.5% of the outcome, and 99% of the time, the forecast was within 2.5% of the realized outcome. This is more than twice as accurate as using historical returns to forecast future returns or using a constant 5% real return as the forecast. Not bad for such a simple forecasting method.
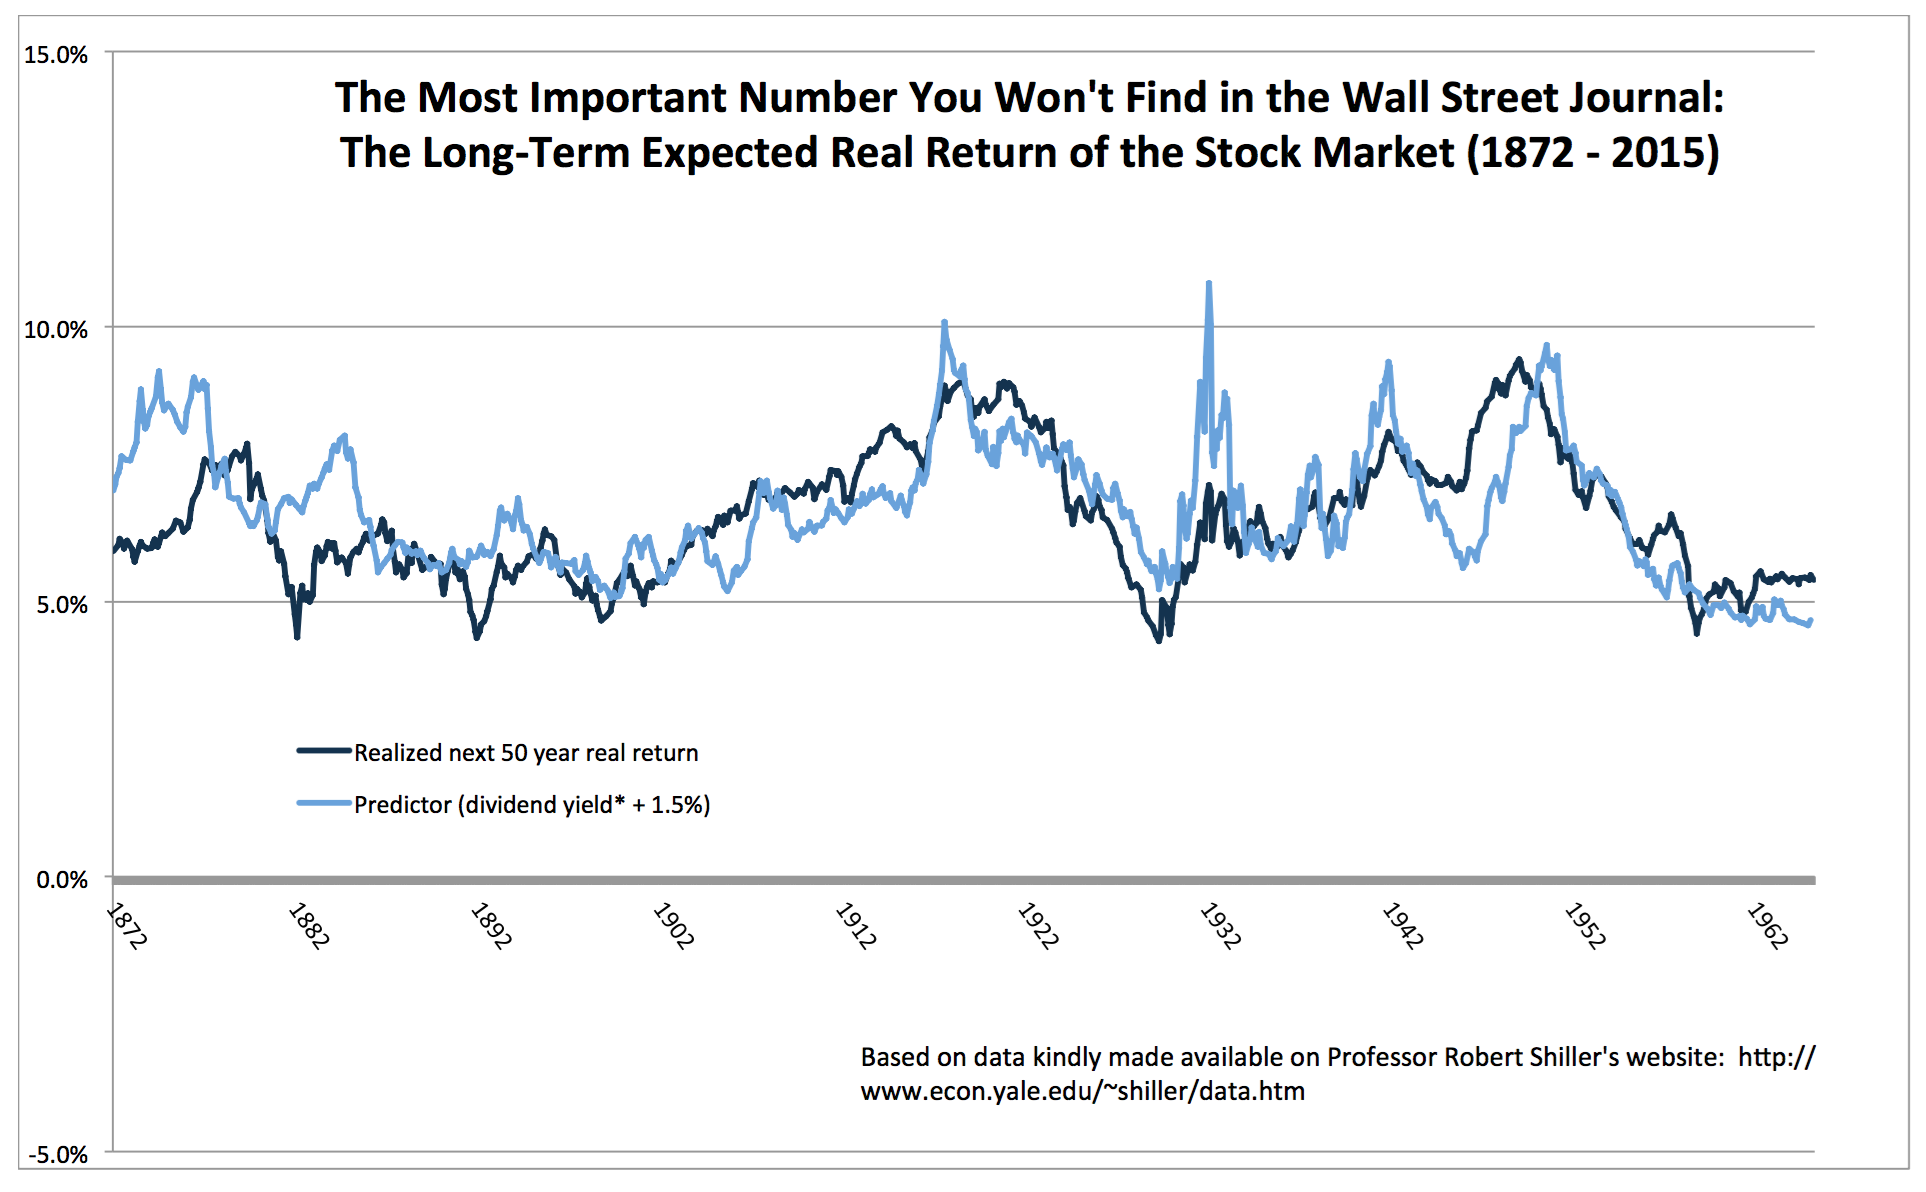
* uses last 12 month dividend yield adjusted for the past year’s performance.
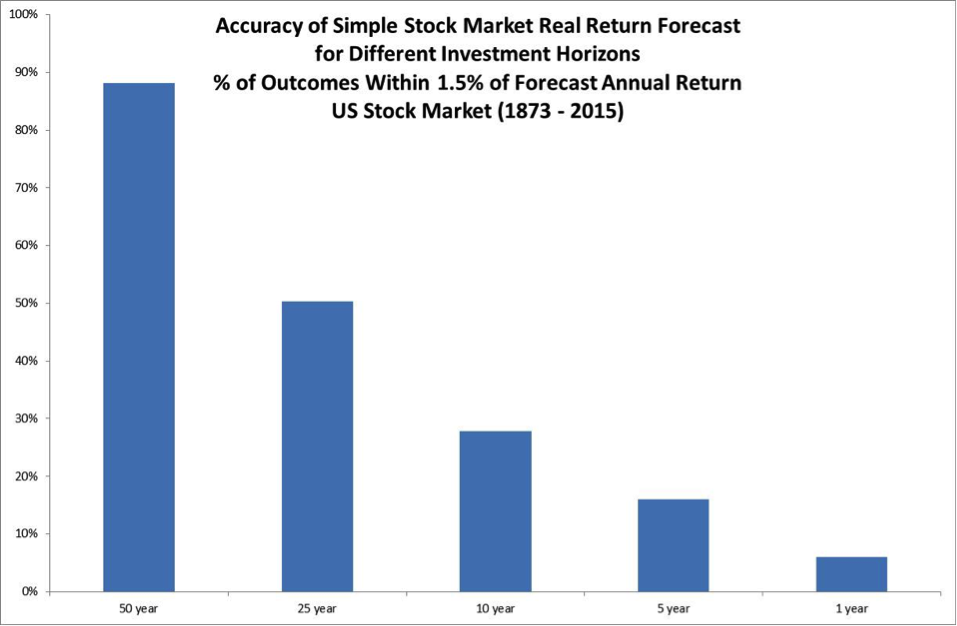
Another question concerned the effect of the time horizon on the accuracy of the forecast. As you’d expect, the shorter the time horizon, the less accurate the forecasts from this simple cash-flow based approach. The chart below shows how the accuracy of the forecast goes down with shorter horizons, using just dividend yield and expected dividend growth for our forecast (ie not including any adjustment for a view regarding future changes in market valuation). For horizons of less than 25 years, we need the mythical crystal ball, while for longer horizons a pencil and the back of a small envelope will do the job.
Finally, a word on real returns versus nominal returns. Real, inflation-adjusted returns are what will determine our future purchasing power. Fortunately, they are also easier to predict; long term real equity returns have been 20% to 40% less volatile than nominal returns over the past 140 years of US stock market history.
There is a rich academic and practitioner research literature on forecasting stock market returns, which deals more rigorously with the topic and also explores the equity expected returns on an international basis. You’ll find an abbreviated list of some relevant reading below.
Robert Shiller, Irrational Exuberance. Princeton University Press, 2000
Jeremy J. Siegel, The Shiller CAPE Ratio: A New Look. University of Pennsylvania Working Paper, 2014
Dimson, Marsh, Staunton et al, Research Institute Yearbook 2015
Note: This note does not constitute an investment offering, but rather is intended to elicit discussion and exploration of better ways to invest. Simulated historical returns and past performance are not indicative of future results.